Fig. 13
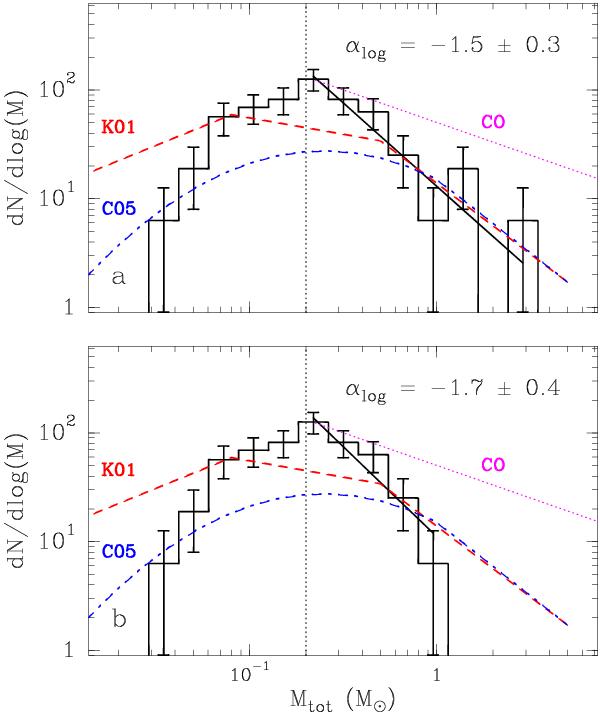
Mass distribution dN/dlog (M) of the starless sources of Cha I and III. Panel a) shows all sources while panel b) displays only those with M/MBE < 1.0. The error bars represent the Poisson noise (in  ). The vertical dotted line is the average (0.20 M⊙) of the estimated 90% completeness limits for Cha I and III. The thick solid line is the best power-law fit performed on the mass bins above the completeness limit. See caption of Fig. 10 for other details. The K01 and C05 IMFs are both vertically shifted to the same number at 5 M⊙.
Current usage metrics show cumulative count of Article Views (full-text article views including HTML views, PDF and ePub downloads, according to the available data) and Abstracts Views on Vision4Press platform.
Data correspond to usage on the plateform after 2015. The current usage metrics is available 48-96 hours after online publication and is updated daily on week days.
Initial download of the metrics may take a while.