Free Access
Fig. 11
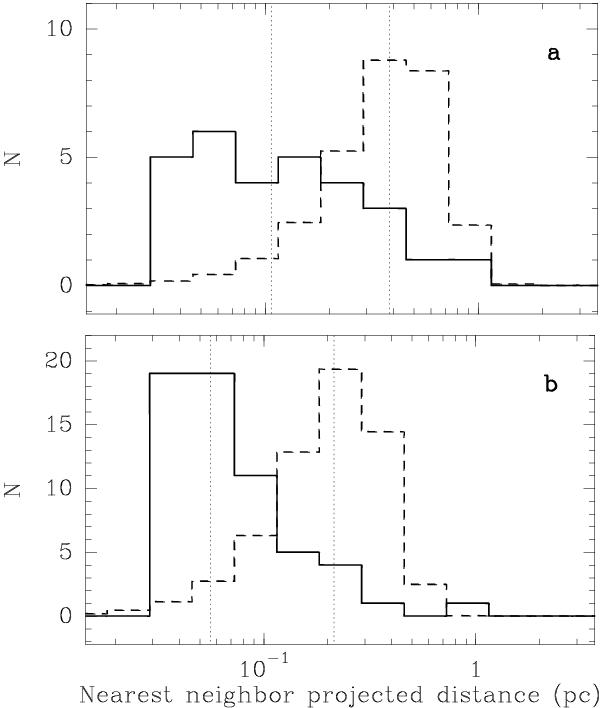
Distribution of nearest-neighbor projected distance for the starless sources of Cha III (a)) and Cha I (b)). In each panel, the dashed histogram shows the distribution expected for the same number of objects randomly distributed in the same area. The median value of each distribution is marked with a dotted line.
This figure is made of several images, please see below:
Current usage metrics show cumulative count of Article Views (full-text article views including HTML views, PDF and ePub downloads, according to the available data) and Abstracts Views on Vision4Press platform.
Data correspond to usage on the plateform after 2015. The current usage metrics is available 48-96 hours after online publication and is updated daily on week days.
Initial download of the metrics may take a while.