Fig. 7
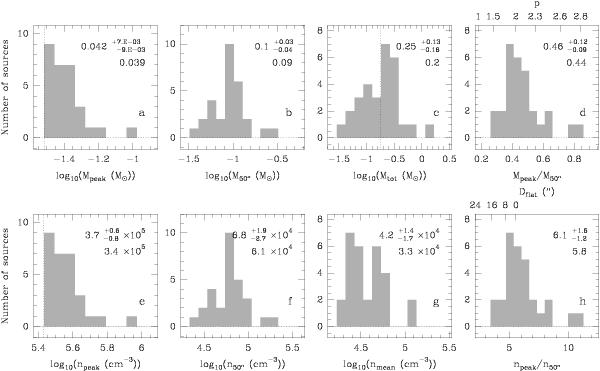
Distributions of masses and free-particle densities obtained for the 29 starless sources found with Gaussclumps in the sum map of Cha III at scale 5. The mean, standard deviation, and median of the distribution are given in each panel. The asymmetric standard deviation defines the range containing 68% of the sample. a) Peak mass of the fitted Gaussian. b) Mass within an aperture of diameter 50″. c) Total mass of the fitted Gaussian. The dotted line indicates the estimated completeness limit at 90% for Gaussian sources corresponding to a 6.3σ peak detection limit for the average source size. d) Mass concentration, ratio of the peak mass to the mass within an aperture of diameter 50″. e) Peak density. f) Mean density within an aperture of diameter 50″. g) Mean density derived from the total mass. h) Density contrast, ratio of peak density to mean density. In panels a) and e), the dotted line indicates the 5σ sensitivity limit. The upper axis of panel d), which can also be used for panel h), shows the power-law exponent p derived assuming that the sources have a density profile proportional to r − p and a uniform dust temperature. Alternately, the upper axis of panel h), which can also be used for panel d), deals with the case where the density is uniform within a diameter Dflat and decreases as r-2 outside, still with the assumption of a uniform temperature.
Current usage metrics show cumulative count of Article Views (full-text article views including HTML views, PDF and ePub downloads, according to the available data) and Abstracts Views on Vision4Press platform.
Data correspond to usage on the plateform after 2015. The current usage metrics is available 48-96 hours after online publication and is updated daily on week days.
Initial download of the metrics may take a while.