Fig. 6
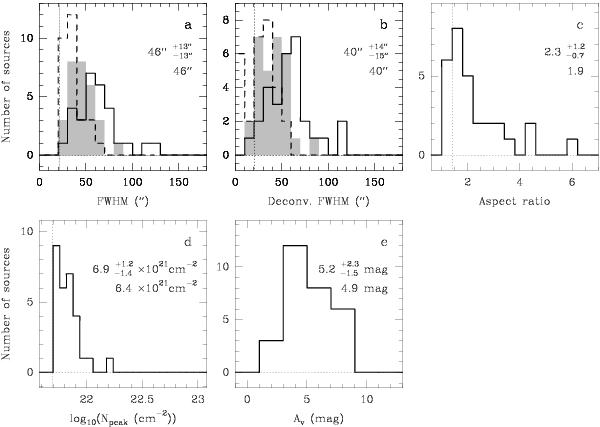
Distributions of physical properties obtained for the 29 starless sources found with Gaussclumps in the sum map of Cha III at scale 5. The mean, standard deviation, and median of the distribution are given in each panel. The asymmetric standard deviation defines the range containing 68% of the sample. a) FWHM sizes along the major (solid line) and minor (dashed line) axes. The filled histogram shows the distribution of geometrical mean of major and minor sizes. The mean and median values refer to the filled histogram. The dotted line indicates the angular resolution (21.2″). b) Same as a) but for the deconvolved sizes. c) Aspect ratios computed with the deconvolved sizes. The dotted line at 1.4 shows the threshold above which the deviation from 1 (elongation) can be considered as significant. d) Peak H2 column density. The dotted line at 5.0 × 1021 cm-2 is the 5σ sensitivity limit. e) Visual extinction derived from 2MASS.
Current usage metrics show cumulative count of Article Views (full-text article views including HTML views, PDF and ePub downloads, according to the available data) and Abstracts Views on Vision4Press platform.
Data correspond to usage on the plateform after 2015. The current usage metrics is available 48-96 hours after online publication and is updated daily on week days.
Initial download of the metrics may take a while.