Fig. 1
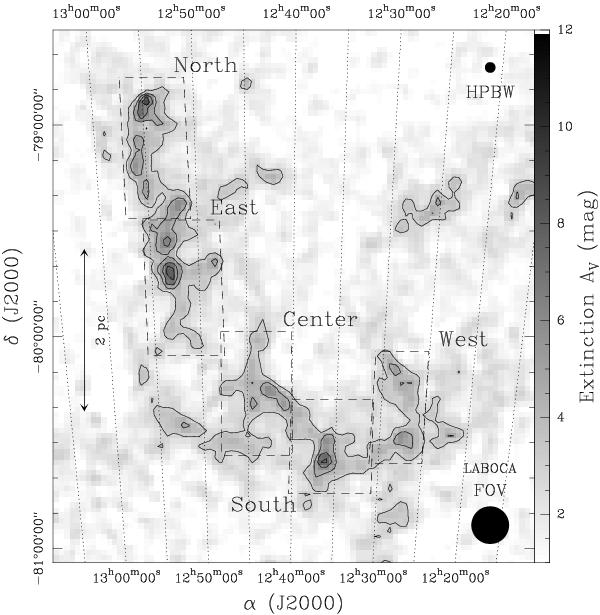
Extinction map of Cha III derived from 2MASS in radio projection. The projection center is at (α,δ)J2000 = (12h42m24s, − 79°43′48″). The contours start at AV = 3 mag and increase by steps of 1.5 mag. The dotted lines are lines of constant right ascension. The angular resolution of the map (HPBW = 3′) is shown in the upper right corner. The five fields selected for mapping with LABOCA are delimited with dashed lines. The field of view of LABOCA is displayed in the lower right corner.
Current usage metrics show cumulative count of Article Views (full-text article views including HTML views, PDF and ePub downloads, according to the available data) and Abstracts Views on Vision4Press platform.
Data correspond to usage on the plateform after 2015. The current usage metrics is available 48-96 hours after online publication and is updated daily on week days.
Initial download of the metrics may take a while.