Fig. 9
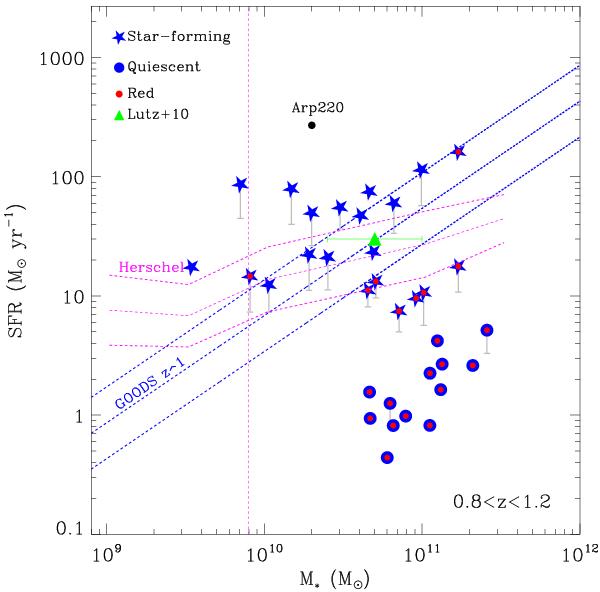
SFR versus stellar masses obtained from the SED fitting for the host galaxies of the Type-2 QSOs in the redshift range 0.8 < z < 1.2. Galaxies with log(SSFR/Gyr-1) > −1 are indicated with a star symbol, otherwise a circle was used. Type-2 QSO hosts with red (U − B) rest-frame colors according to the color division by Willmer et al. (2006) have been highlighted with a smaller lighter circle. The vertical bars show the variation in SFR if an unobscured AGN component is included in the SED fitting procedure (see Sect. 5). The dashed lines are the correlation and its one-σ confidence intervals found for blue star-forming galaxies by Elbaz et al. (2007) and PACS/Herschel sources by Rodighiero et al. (2010) at z ≈ 1. The curves have been rescaled from the original Salpeter IMF to the Chabrier IMF adopted in this work. The vertical dashed line indicates the mass completeness limit of the PACS sample. The triangle indicates the average SFR for the hosts of X-ray selected AGNs estimated by Lutz et al. (2010) by stacking 870 μm LABOCA/APEX data.
Current usage metrics show cumulative count of Article Views (full-text article views including HTML views, PDF and ePub downloads, according to the available data) and Abstracts Views on Vision4Press platform.
Data correspond to usage on the plateform after 2015. The current usage metrics is available 48-96 hours after online publication and is updated daily on week days.
Initial download of the metrics may take a while.