Fig. 8
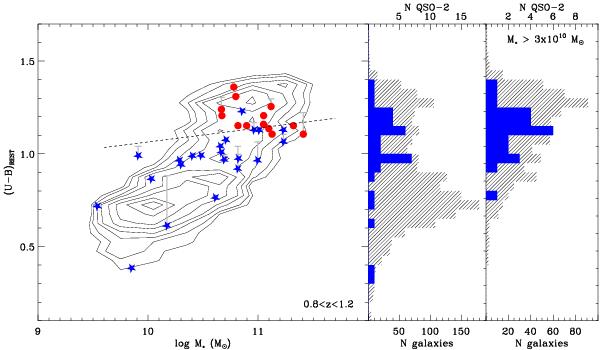
Left panel. Color-mass diagram in the redshift range 0.8 < z < 1.2 for the comparison sample of normal galaxies (gray contours), and the Type-2 QSOs hosts. The rest-frame colors of the Type-2 QSOs hosts have been measured after removing the contribution from the AGN. Star-forming galaxies are indicated with the star symbol, while the circles correspond to passive galaxies. The dashed curve is the dividing line between red passive and blue star-forming galaxies at z = 1 according to Peng et al. (2010). The vertical bars show the variation in rest-frame colors if an unobscured AGN component is included in the SED fitting procedure (see Sect. 5). Central panel. U − B rest-frame color distribution for the Type-2 QSOs host galaxies (filled histogram) and the comparison sample of normal galaxies (hatched histogram) in the redshift range 0.8 < z < 1.2. Right panel. As in the central panel but only for sources with M ⋆ > 3 × 10¹⁰M⊙.
Current usage metrics show cumulative count of Article Views (full-text article views including HTML views, PDF and ePub downloads, according to the available data) and Abstracts Views on Vision4Press platform.
Data correspond to usage on the plateform after 2015. The current usage metrics is available 48-96 hours after online publication and is updated daily on week days.
Initial download of the metrics may take a while.