Fig. 10
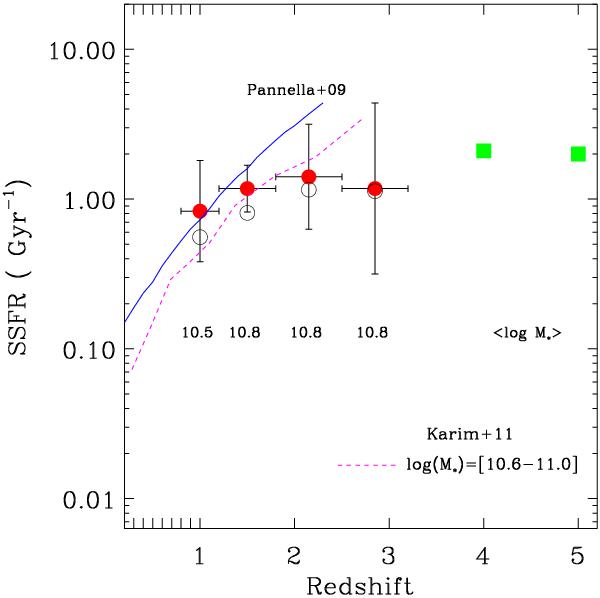
Evolution of the average SSFR for Type-2 QSOs hosts as a function of redshift. For each redshift bin we report the average stellar mass of the host galaxies. Empty circles indicate the average SSFR per redshift bin if an unobscured AGN component is included in the SED fitting procedure (see Sect. 5). The continuum line reproduces the evolution law found by Pannella et al. (2009) for star-forming galaxies up to z ~ 2. The dashed line instead is the best fit to the SSFR redshift evolution derived by Karim et al. (2011) in the mass range log(M ⋆ ) = [10.6, 11.0] M⊙. The two squares are the SSFR for normal galaxies at z = [4,5] as presented by Gonzalez et al. (2010) using data from Stark et al. (2009).
Current usage metrics show cumulative count of Article Views (full-text article views including HTML views, PDF and ePub downloads, according to the available data) and Abstracts Views on Vision4Press platform.
Data correspond to usage on the plateform after 2015. The current usage metrics is available 48-96 hours after online publication and is updated daily on week days.
Initial download of the metrics may take a while.