Fig. 9
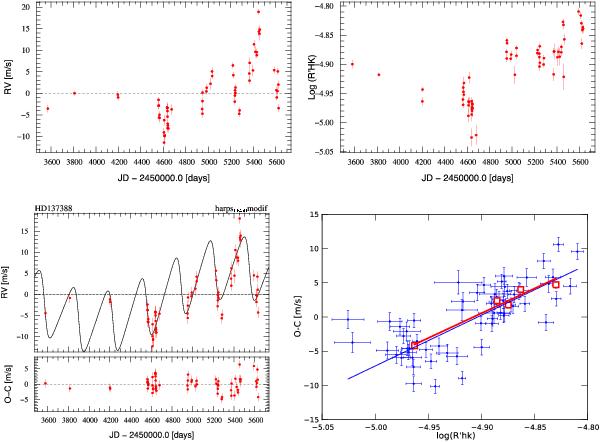
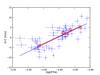
All the graphs are for HD 137388. Top panel: RVs and the activity index, log( ), as a function of time. Lower left panel: RV signal of the planet, in addition to the long-period variation associated to the magnetic cycle. Lower right panel: correlation between the RV residuals (O−C) after removing the planet and the activity index. Small points correspond to all the measurements, whereas large squares represent the same data binned over three months to average out short-term activity.
Current usage metrics show cumulative count of Article Views (full-text article views including HTML views, PDF and ePub downloads, according to the available data) and Abstracts Views on Vision4Press platform.
Data correspond to usage on the plateform after 2015. The current usage metrics is available 48-96 hours after online publication and is updated daily on week days.
Initial download of the metrics may take a while.