Fig. 4
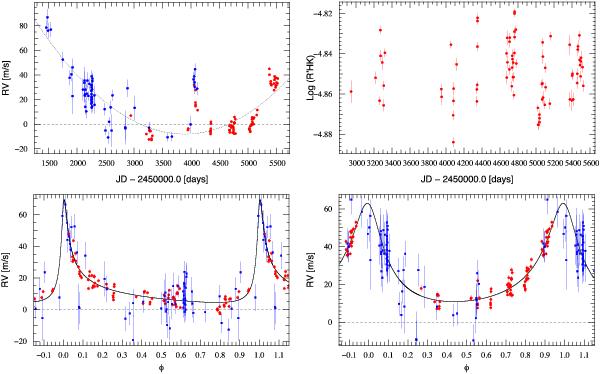
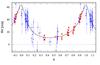
All the graphs are for HD 7449. Top panel: RVs and the activity index, log( ), as a function of time. Blue points (dark) are for CORALIE and red points (gray) for HARPS. Note that the CORALIE pipeline does not return the activity index. Lower panel: orbital solution folded in phase for the best-fit solution of the short-period planet (left) and the long-period one (right).
Current usage metrics show cumulative count of Article Views (full-text article views including HTML views, PDF and ePub downloads, according to the available data) and Abstracts Views on Vision4Press platform.
Data correspond to usage on the plateform after 2015. The current usage metrics is available 48-96 hours after online publication and is updated daily on week days.
Initial download of the metrics may take a while.