Fig. 4
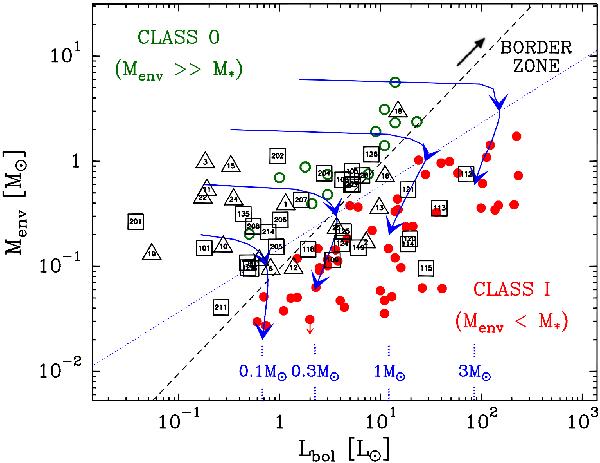
Envelope mass versus bolometric luminosity diagram comparing the locations of the protostars detected with MAMBO in the Aquila rift region (open triangles for the Serpens South sub-field, open squares for the other sub-fields) with the positions of known low-mass Class I (filled circles) and Class 0 objects (open circles) in Ophiuchus, Perseus, and Orion (André et al. 2000; Motte & André 2001). Numbers reported inside triangles are the reference numbers of the sources reported in the last column of Table 1. Model protostellar evolutionary tracks, computed for various final stellar masses (indicated above the Lbol axis) assuming the accretion/luminosity history described in the text, are superimposed (4 blue tracks representing protostellar evolution for objects with final masses 0.1, 0.3, 1 and 3M⊙). Evolution proceeds from the upper left to the lower right as indicated by two arrows on each track, plotted when 50% and 90% of the final stellar mass has been accreted, respectively. The straight lines show two Menv–Lbol relations marking the conceptual border zone between the Class 0 (Menv > M ⋆ /ϵ) and the Class I (Menv < M ⋆ /ϵ) stage, where ϵ is the local star formation efficiency taken here to be 50%. The dashed line is such that Menv ∝ Lbol (cf. André et al. 1993; André & Montmerle 1994), while the dotted relation follows  as suggested by the accretion scenario adopted in the tracks (see also Bontemps et al. 1996). The typical uncertainty in the plotted values of Lbol is ~30–40%, while the uncertainty in the Menv values is a factor of ~2 (see Sect. 3.2). The black arrow in the upper right indicates how the positions of the W40 protostars would move in the diagram if a distance of 600 pc was adopted for W40, instead of 260 pc.
Current usage metrics show cumulative count of Article Views (full-text article views including HTML views, PDF and ePub downloads, according to the available data) and Abstracts Views on Vision4Press platform.
Data correspond to usage on the plateform after 2015. The current usage metrics is available 48-96 hours after online publication and is updated daily on week days.
Initial download of the metrics may take a while.