Fig. 1
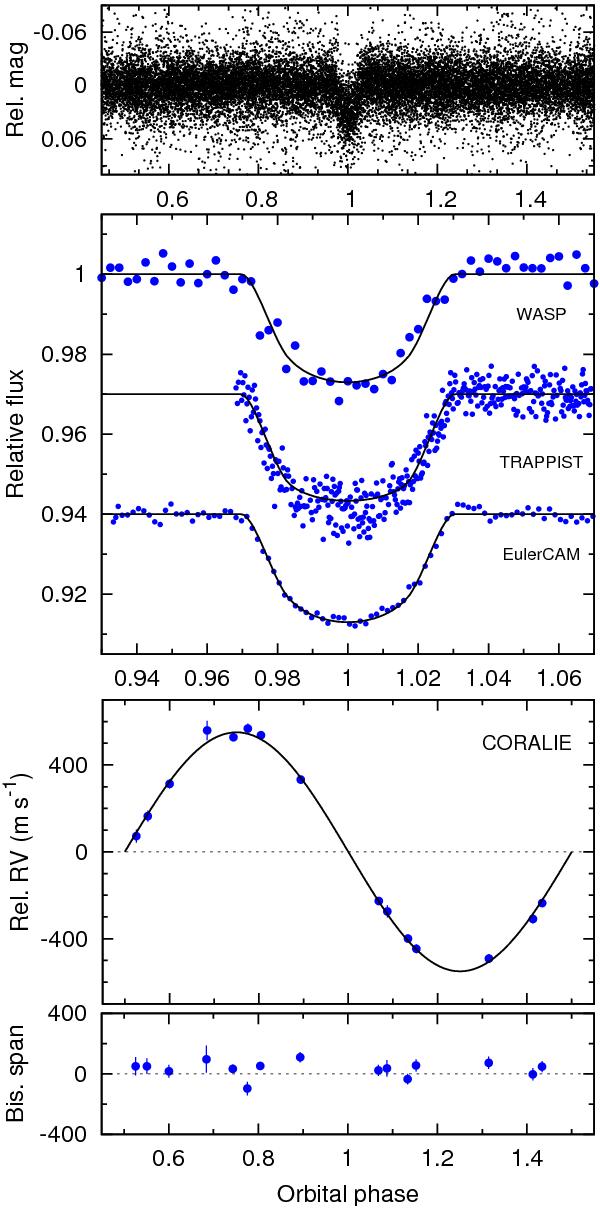
(Top) The WASP-South lightcurve folded on the 0.81-d transit period. (Second panel) The binned WASP data with (offset) the TRAPPIST (I+z) and Euler (Gunn r) transit lightcurves, with the fitted MCMC model. (Third) The CORALIE radial velocities with the fitted model. (Lowest) The bisector spans; the absence of any correlation with radial velocity is a check against transit mimics.
Current usage metrics show cumulative count of Article Views (full-text article views including HTML views, PDF and ePub downloads, according to the available data) and Abstracts Views on Vision4Press platform.
Data correspond to usage on the plateform after 2015. The current usage metrics is available 48-96 hours after online publication and is updated daily on week days.
Initial download of the metrics may take a while.