Free Access
Fig. 4
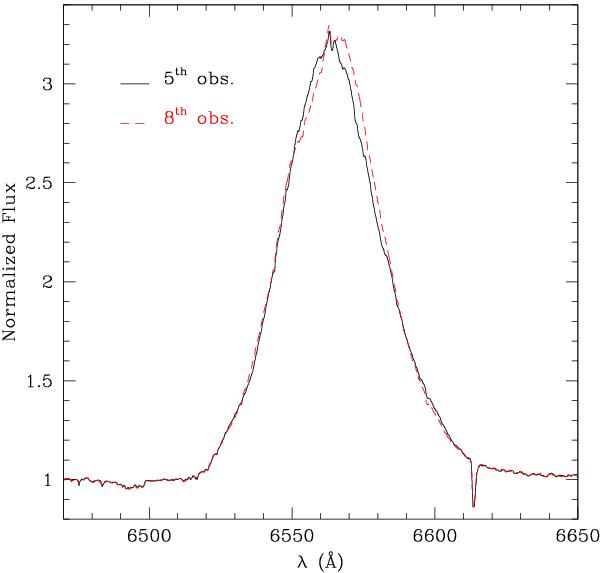
Illustration of the Hα line profile in the spectrum of WR 20b for those two observations corresponding to the maximum difference in apparent RV. The RV variations are clearly due to the top part of the line profile only.
Current usage metrics show cumulative count of Article Views (full-text article views including HTML views, PDF and ePub downloads, according to the available data) and Abstracts Views on Vision4Press platform.
Data correspond to usage on the plateform after 2015. The current usage metrics is available 48-96 hours after online publication and is updated daily on week days.
Initial download of the metrics may take a while.