Fig. 9
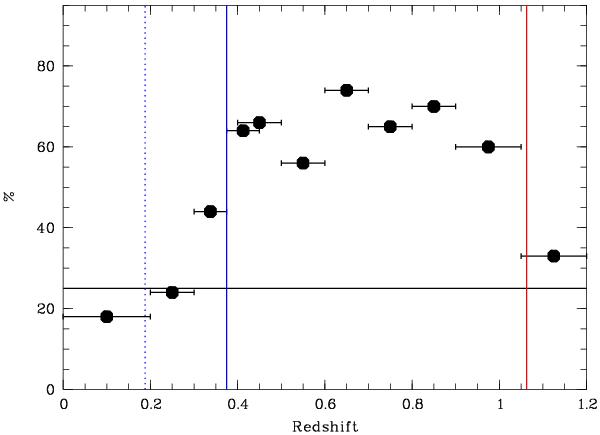
Percentage of A10 candidate cluster redetection as a function of redshift. Horizontal line: statistical random probability to have a match between T0004 and T0006 candidate clusters. Vertical blue dotted line: redshift where the Balmer break passes the middle of the g′ band. Vertical blue continuous line: redshift where the Balmer break exits the g′ band. Vertical red line: redshift where the Balmer break enters the z′ band.
Current usage metrics show cumulative count of Article Views (full-text article views including HTML views, PDF and ePub downloads, according to the available data) and Abstracts Views on Vision4Press platform.
Data correspond to usage on the plateform after 2015. The current usage metrics is available 48-96 hours after online publication and is updated daily on week days.
Initial download of the metrics may take a while.