Fig. 8
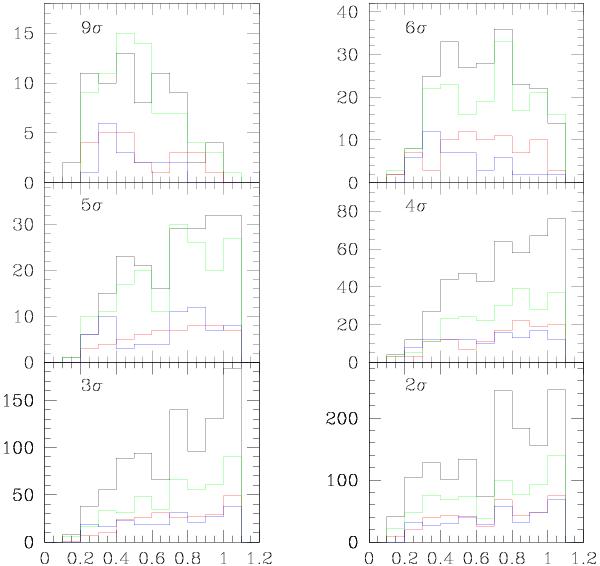
Histograms of the photometric redshift distributions for the candidate clusters in the four fields, colour coded as: black for Wide 1, red for Wide 2, green for Wide 3 and blue for Wide 4. The six figures correspond to the detection levels adopted: 9σs (top left), 6σs (top right), 5σs (middle left), 4σs (middle right), 3σs (bottom left), and 2σs (bottom right).
Current usage metrics show cumulative count of Article Views (full-text article views including HTML views, PDF and ePub downloads, according to the available data) and Abstracts Views on Vision4Press platform.
Data correspond to usage on the plateform after 2015. The current usage metrics is available 48-96 hours after online publication and is updated daily on week days.
Initial download of the metrics may take a while.