Fig. 3
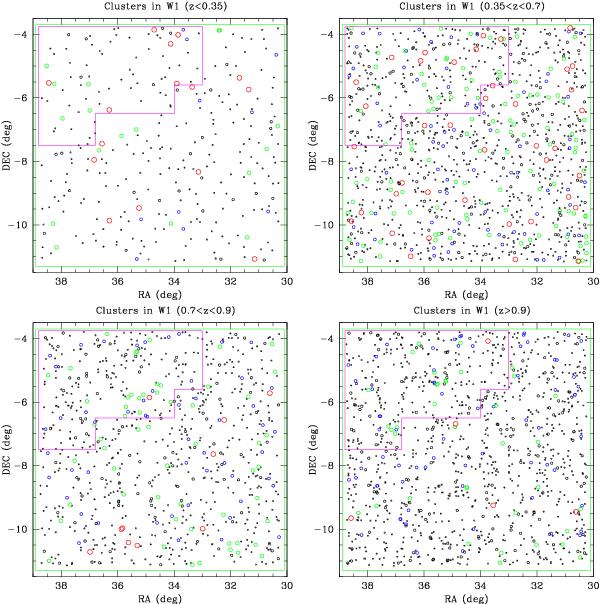
Spatial distribution of our detections in the W1 field, divided in four photometric redshift bins for the sake of clarity: top left z < 0.35; top right: 0.35 < z < 0.7; bottom left 0.7 < z < 0.9; bottom right: z > 0.9. The symbols are large red circles: S/N ≥ 9; large green circles: S/N ≥ 6; medium blue circles: S/N ≥ 5; medium black circles: S/N ≥ 4; small black circles: S/N ≥ 3 and S/N ≥ 2. The area covered by the T0004 data release analysed by A10 is shown in magenta.
Current usage metrics show cumulative count of Article Views (full-text article views including HTML views, PDF and ePub downloads, according to the available data) and Abstracts Views on Vision4Press platform.
Data correspond to usage on the plateform after 2015. The current usage metrics is available 48-96 hours after online publication and is updated daily on week days.
Initial download of the metrics may take a while.