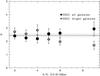
Fig. 20
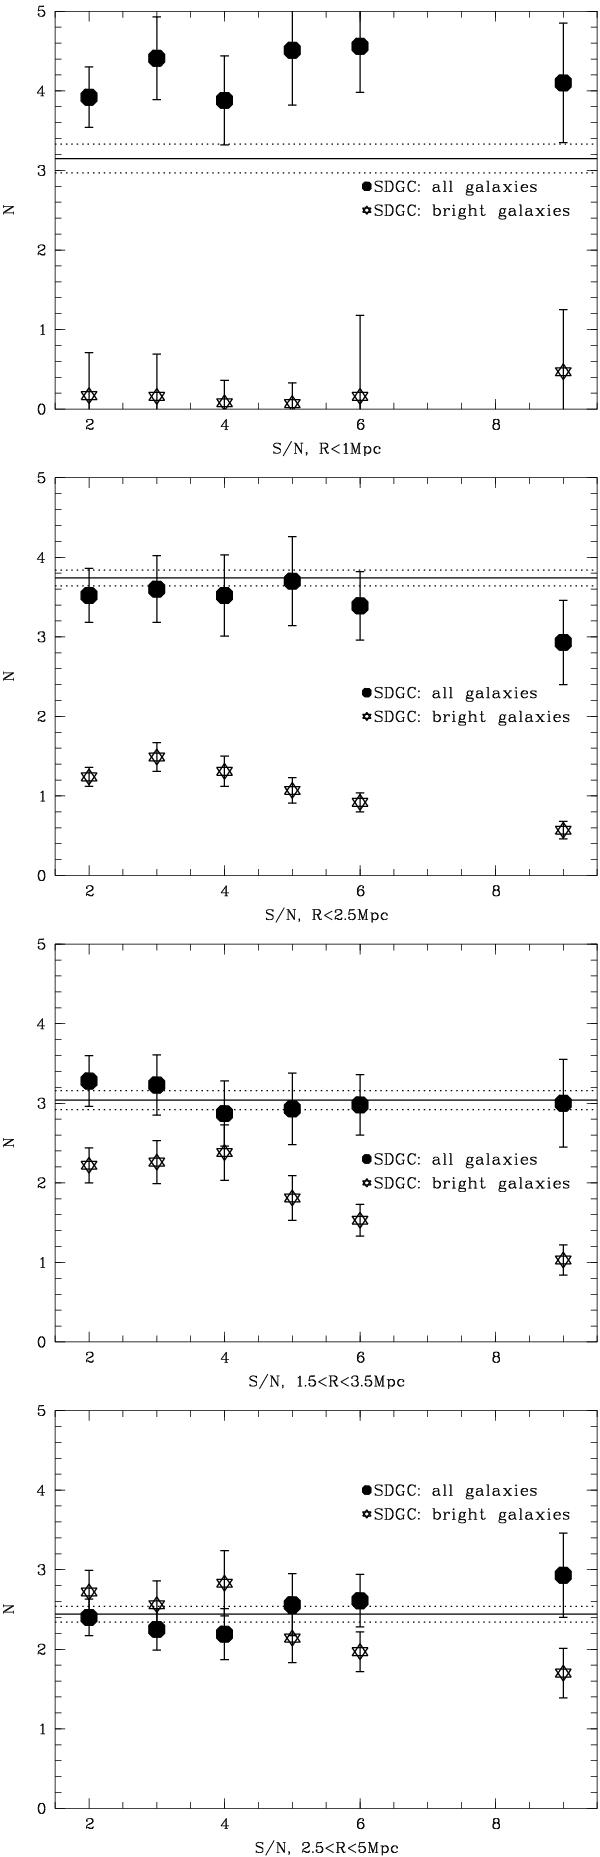
Mean number of significant detected galaxy concentrations (SDGC) around the sample of 491 clusters in W1 from T0006+Th09 as a function of cluster detection level (S/N) in the T0006 sample, in regions of different radii. From top to bottom the radii are: R < 1 Mpc, R < 2.5 Mpc, 1.5 < R < 3.5 Mpc, and 2.5 < R < 5 Mpc. Filled circles: SDGC detected with galaxies in the largest possible magnitude interval (see text). Open stars: SDGC detected with galaxies brighter than the considered cluster cDs (see text). Continuous line: mean number of SDGC in the random sample with its error (dotted lines). The uncertainty (interval between the two dotted lines) is computed as the second-order momentum of the SDGC distribution across the field of view (in pixels of 0.2 × 0.2 deg2). By “all galaxies” and “bright galaxies” we mean galaxies belonging to intervals I and II, respectively.
Current usage metrics show cumulative count of Article Views (full-text article views including HTML views, PDF and ePub downloads, according to the available data) and Abstracts Views on Vision4Press platform.
Data correspond to usage on the plateform after 2015. The current usage metrics is available 48-96 hours after online publication and is updated daily on week days.
Initial download of the metrics may take a while.