Fig. 16
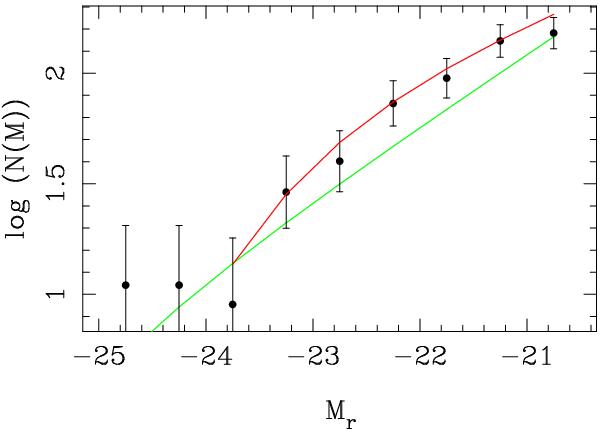
Galaxy luminosity function for the galaxies of the 45 stacked clusters selected in red in Fig. 15 (showing the logarithm of the number of galaxies expressed in units of galaxies/deg2/0.5 mag). The green line shows the best Schechter function fit when all the points are included and the red line shows the best Schechter function after excluding the two brightest points.
Current usage metrics show cumulative count of Article Views (full-text article views including HTML views, PDF and ePub downloads, according to the available data) and Abstracts Views on Vision4Press platform.
Data correspond to usage on the plateform after 2015. The current usage metrics is available 48-96 hours after online publication and is updated daily on week days.
Initial download of the metrics may take a while.