Fig. 15
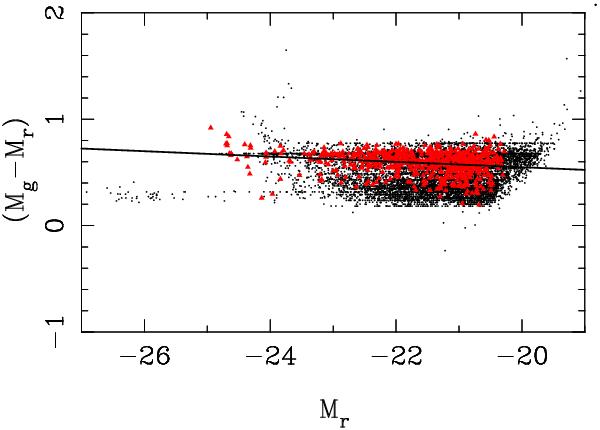
Colour–magnitude diagram for 45 stacked clusters (see text). The black points are all the galaxies in a radius of 1 Mpc around each cluster centre, and with an absolute magnitude Mz′ < −21.0. The red points correspond to the subsample of these galaxies within ± 0.1 of the cluster redshift. The black line shows the best fit to the colour − magnitude relation drawn from the red points
Current usage metrics show cumulative count of Article Views (full-text article views including HTML views, PDF and ePub downloads, according to the available data) and Abstracts Views on Vision4Press platform.
Data correspond to usage on the plateform after 2015. The current usage metrics is available 48-96 hours after online publication and is updated daily on week days.
Initial download of the metrics may take a while.