Fig. 12
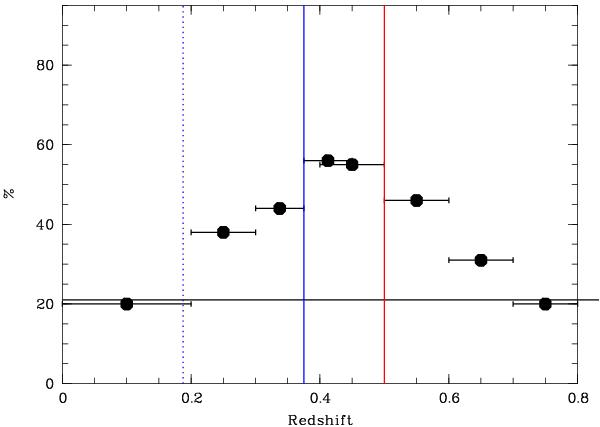
Percentage of Thanjavur et al. (2009) candidate clusters redetected in the present paper as a function of redshift. Horizontal line: statistical random probability of a match. Vertical blue dotted line: redshift where the Balmer break passes the middle of the g′ band. Vertical blue continuous line: redshift where the Balmer break exits the g′ band. Vertical red line: redshift where the Thanjavur et al. (2009) method starts missing more than 10% Fornax-like clusters.
Current usage metrics show cumulative count of Article Views (full-text article views including HTML views, PDF and ePub downloads, according to the available data) and Abstracts Views on Vision4Press platform.
Data correspond to usage on the plateform after 2015. The current usage metrics is available 48-96 hours after online publication and is updated daily on week days.
Initial download of the metrics may take a while.