Fig. 11
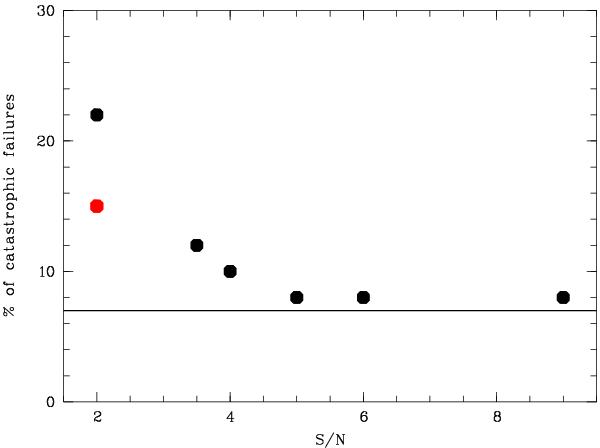
Black dots: percentage of catastrophic photometric redshift failures in the 33 T0006 candidate clusters in the VVDS spectroscopic area as a function of S/N. The point at S/N = 3.5 was obtained by combining the S/N = 3 and S/N = 4 data. Red dot: percentage of catastrophic photometric redshift failures in the S/N = 2 T0006 candidate clusters in the VVDS spectroscopic area also detected by A10. The horizontal line shows the mean percentage of catastrophic photometric redshift failures for the whole photometric redshift sample (not only in clusters) in the VVDS area.
Current usage metrics show cumulative count of Article Views (full-text article views including HTML views, PDF and ePub downloads, according to the available data) and Abstracts Views on Vision4Press platform.
Data correspond to usage on the plateform after 2015. The current usage metrics is available 48-96 hours after online publication and is updated daily on week days.
Initial download of the metrics may take a while.