Free Access
Fig. 9
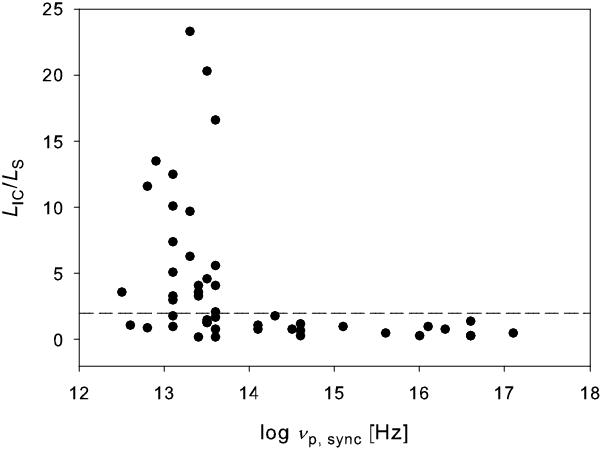
The Compton dominance plotted against the synchrotron peak frequency, both data sets from Abdo et al. (2010a). Sources above the dashed line at LIC/Ls = 2 are Compton dominated according to the classification of Abdo et al. (2010a).
Current usage metrics show cumulative count of Article Views (full-text article views including HTML views, PDF and ePub downloads, according to the available data) and Abstracts Views on Vision4Press platform.
Data correspond to usage on the plateform after 2015. The current usage metrics is available 48-96 hours after online publication and is updated daily on week days.
Initial download of the metrics may take a while.