Free Access
Fig. 5
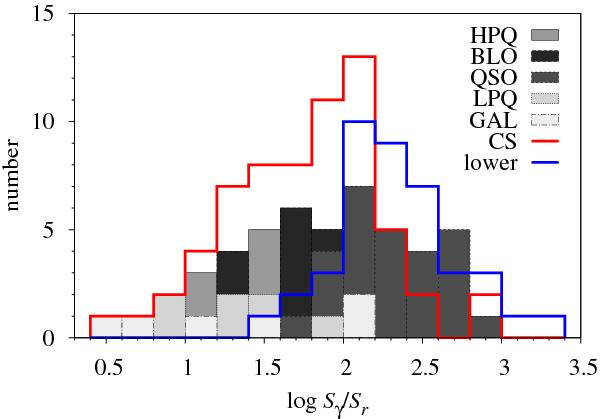
The distribution of the gamma dominance log Sγ/Sr. Different AGN subsamples are depicted with different shades, and the coloured lines mark the complete sample and the sources with only lower limit estimate of the gamma dominance.
Current usage metrics show cumulative count of Article Views (full-text article views including HTML views, PDF and ePub downloads, according to the available data) and Abstracts Views on Vision4Press platform.
Data correspond to usage on the plateform after 2015. The current usage metrics is available 48-96 hours after online publication and is updated daily on week days.
Initial download of the metrics may take a while.