Free Access
Fig. 2
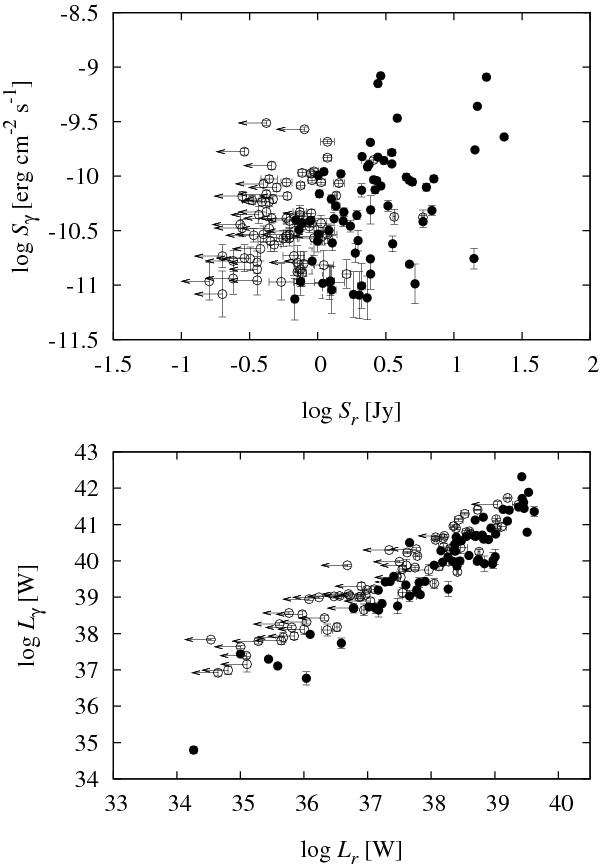
The flux and luminosity correlations between 37 GHz and the Fermi band. Solid circles represent the complete northern sample, and 37 GHz upper limits are indicated by arrows.
Current usage metrics show cumulative count of Article Views (full-text article views including HTML views, PDF and ePub downloads, according to the available data) and Abstracts Views on Vision4Press platform.
Data correspond to usage on the plateform after 2015. The current usage metrics is available 48-96 hours after online publication and is updated daily on week days.
Initial download of the metrics may take a while.