Fig. 7
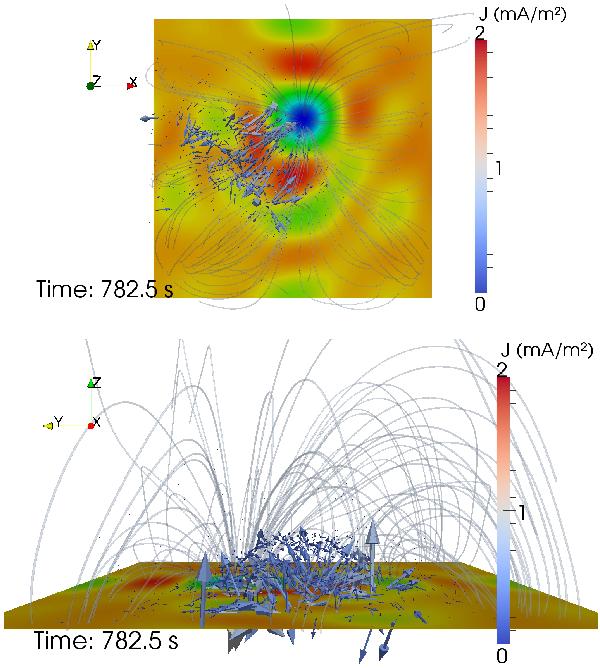
Top (top panel) and lateral (bottom panel) views of the distribution of current density at t = 782.5 s for the second numerical experiment when plasma is moved southward over the positive polarity P11–P12. The arrows show the current direction, and the size and color of the arrows indicate the current density amplitude. Also shown are the Z component of the magnetic field at the bottom of the simulation box and corresponding magnetic field lines. The lateral view is along the positive X axis.
Current usage metrics show cumulative count of Article Views (full-text article views including HTML views, PDF and ePub downloads, according to the available data) and Abstracts Views on Vision4Press platform.
Data correspond to usage on the plateform after 2015. The current usage metrics is available 48-96 hours after online publication and is updated daily on week days.
Initial download of the metrics may take a while.