Fig. 2
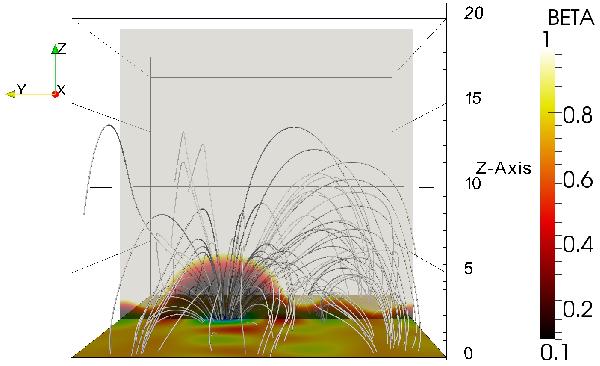
View at the simulation box in the positive X-axis direction with the coordinates given in normalized (dimensionless) units. The distribution of plasma beta is shown in a vertical cutting plane through x = 10.9L0 (1L0 = 107 m) (color coded as indicated). Above the colored region the plasma beta is larger than unity (colored in gray). Also shown is the vertical component of the magnetic field at the bottom of the simulation box and magnetic field lines colored by the corresponding value of the plasma beta. Again, gray corresponds to plasma beta over unity.
Current usage metrics show cumulative count of Article Views (full-text article views including HTML views, PDF and ePub downloads, according to the available data) and Abstracts Views on Vision4Press platform.
Data correspond to usage on the plateform after 2015. The current usage metrics is available 48-96 hours after online publication and is updated daily on week days.
Initial download of the metrics may take a while.