Fig. 9
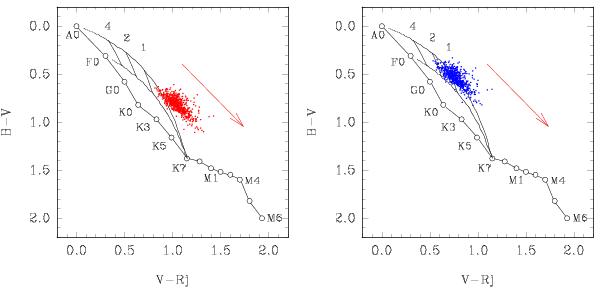
Two-colour diagrams with a grid of “star + spot” models, shown with the bow-shaped curves. The numbers along the curves represent the amount of veiling in each model. In the left panel, the cluster of dots are the observed colours of DR Tau. In the right panel, a correction for interstellar reddening AV = 1ṃ0 has been applied. The slope of the interstellar reddening is indicated with an arrow.
Current usage metrics show cumulative count of Article Views (full-text article views including HTML views, PDF and ePub downloads, according to the available data) and Abstracts Views on Vision4Press platform.
Data correspond to usage on the plateform after 2015. The current usage metrics is available 48-96 hours after online publication and is updated daily on week days.
Initial download of the metrics may take a while.