Fig. 8
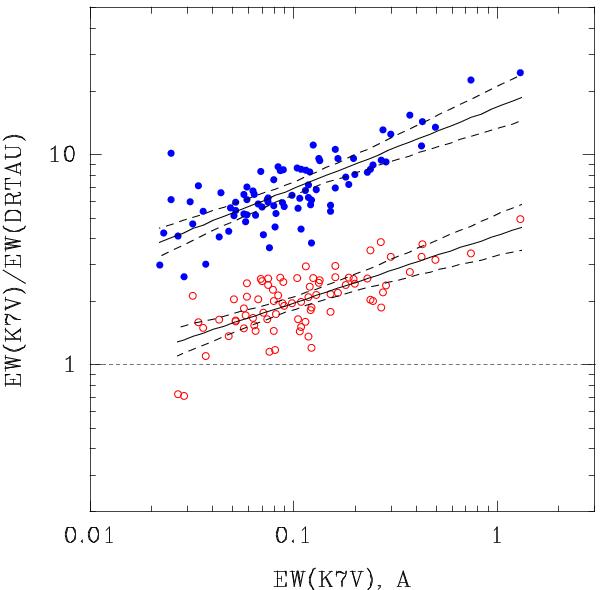
Ratio of EWs of photospheric lines of DR Tau and the observed K7V template HD 28343 as a function of line strength. Filled circles – averaged spectrum of DR Tau. Open circles – low-veiling spectrum of DR Tau. Regression lines are shown for both sequences. The 99% confidence intervals are outlined by dashed curves. The scatter of points around the regression lines is caused by errors of measurements of EWs. The horizontal dashed line corresponds to zero veiling.
Current usage metrics show cumulative count of Article Views (full-text article views including HTML views, PDF and ePub downloads, according to the available data) and Abstracts Views on Vision4Press platform.
Data correspond to usage on the plateform after 2015. The current usage metrics is available 48-96 hours after online publication and is updated daily on week days.
Initial download of the metrics may take a while.