Fig. 12
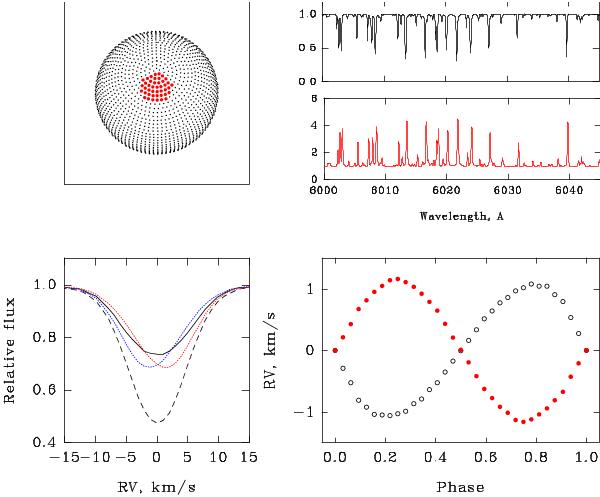
Upper panels: location of the chromospheric spot and the local spectra corresponding to the undisturbed photosphere (absorption) and to the spot (emission). Lower panels: left – profiles of the Ca i λ 6039 Å line, corresponding to phases 0.0 (spot facing the observer, solid line), 0.22 and 0.78 (maximal blue- and red-shifted absorption, dotted lines). Dashed profile: a normal photosphere without spot; right – RV-variations of absorption lines (open circles) and emission lines (filled circle).
Current usage metrics show cumulative count of Article Views (full-text article views including HTML views, PDF and ePub downloads, according to the available data) and Abstracts Views on Vision4Press platform.
Data correspond to usage on the plateform after 2015. The current usage metrics is available 48-96 hours after online publication and is updated daily on week days.
Initial download of the metrics may take a while.