Fig. 3
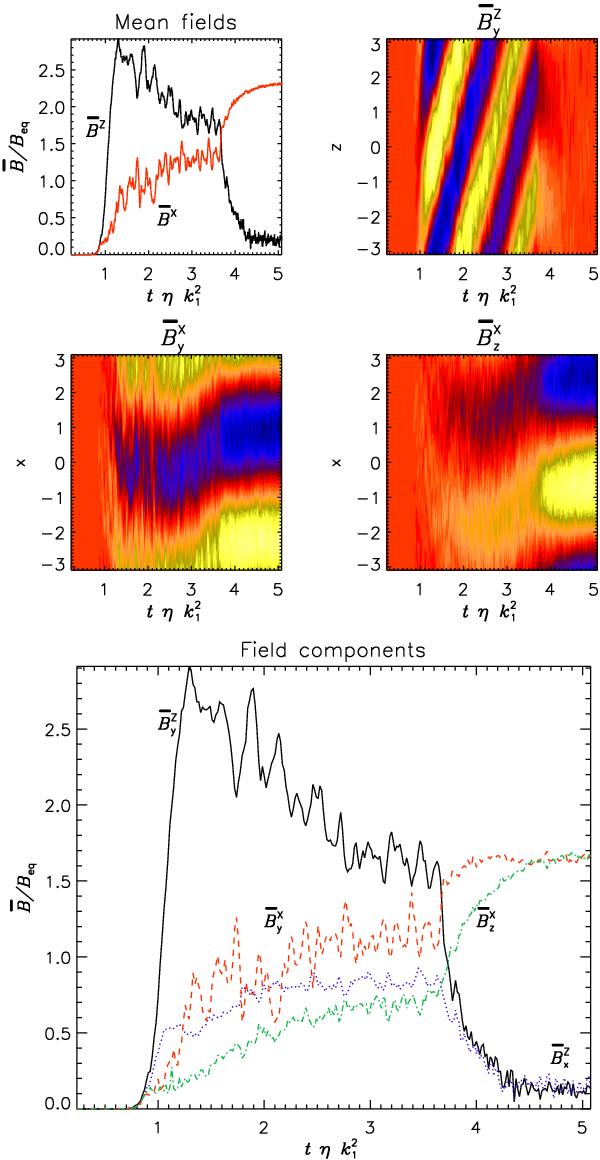
Time series for Run A. Upper row: same quantities as in Fig. 1. Middle row:
 and
and
 , to
be associated with the α2 mode. Note that the
α2Ω and α2 modes coexist
during the transition. Lower panel: rms values of the components of
, to
be associated with the α2 mode. Note that the
α2Ω and α2 modes coexist
during the transition. Lower panel: rms values of the components of
 and
and
 .
.
Current usage metrics show cumulative count of Article Views (full-text article views including HTML views, PDF and ePub downloads, according to the available data) and Abstracts Views on Vision4Press platform.
Data correspond to usage on the plateform after 2015. The current usage metrics is available 48-96 hours after online publication and is updated daily on week days.
Initial download of the metrics may take a while.