Fig. 2
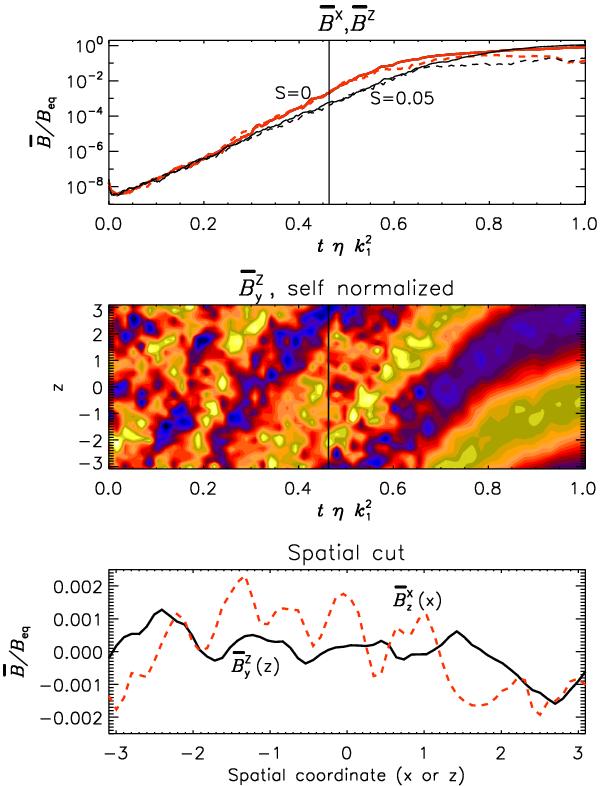
Time series of the rms values of  and
and
 for
Run A and its shearless counterpart. Top panel: black/thin for
S = −0.05; red/thick for S = 0; solid for
for
Run A and its shearless counterpart. Top panel: black/thin for
S = −0.05; red/thick for S = 0; solid for
 ,
dashed for
,
dashed for  .
Middle panel: butterfly diagram of
.
Middle panel: butterfly diagram of
 for
the sheared case, where is
normalized to its instantaneous rms value. Bottom panel: spatial cut
of mean field components at a time during the kinematic regime (indicated by the
vertical line in the two other panels); black/solid with shear, red/dashed without.
for
the sheared case, where is
normalized to its instantaneous rms value. Bottom panel: spatial cut
of mean field components at a time during the kinematic regime (indicated by the
vertical line in the two other panels); black/solid with shear, red/dashed without.
Current usage metrics show cumulative count of Article Views (full-text article views including HTML views, PDF and ePub downloads, according to the available data) and Abstracts Views on Vision4Press platform.
Data correspond to usage on the plateform after 2015. The current usage metrics is available 48-96 hours after online publication and is updated daily on week days.
Initial download of the metrics may take a while.