Fig. 14
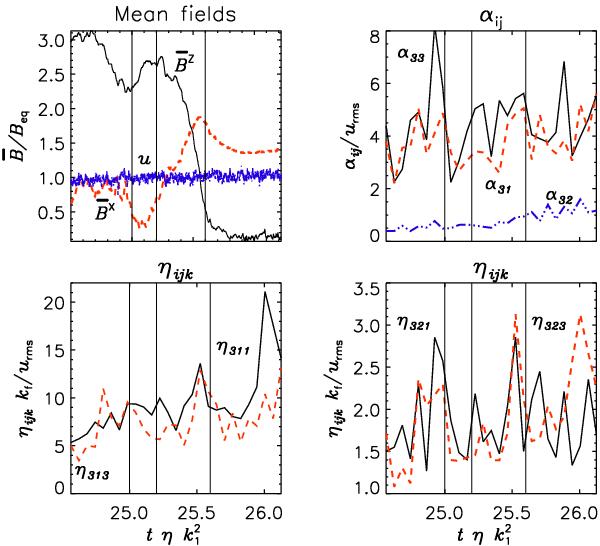
Run H. Upper left panel: rms values of
 ,
,
 and
u (
and
u ( ),
cf. Fig. 10. Remaining panels: selected
quadrupolar moments of αij and
ηijk determined by the test-field
method and given by
),
cf. Fig. 10. Remaining panels: selected
quadrupolar moments of αij and
ηijk determined by the test-field
method and given by  ,
see Eq. (34); likewise for
ηijk. Normalization is by the
temporally averaged urms, as
urms undergoes a slow, steady drift over time.
Vertical lines mark the times of events visible in the first panel.
,
see Eq. (34); likewise for
ηijk. Normalization is by the
temporally averaged urms, as
urms undergoes a slow, steady drift over time.
Vertical lines mark the times of events visible in the first panel.
Current usage metrics show cumulative count of Article Views (full-text article views including HTML views, PDF and ePub downloads, according to the available data) and Abstracts Views on Vision4Press platform.
Data correspond to usage on the plateform after 2015. The current usage metrics is available 48-96 hours after online publication and is updated daily on week days.
Initial download of the metrics may take a while.