Fig. 10
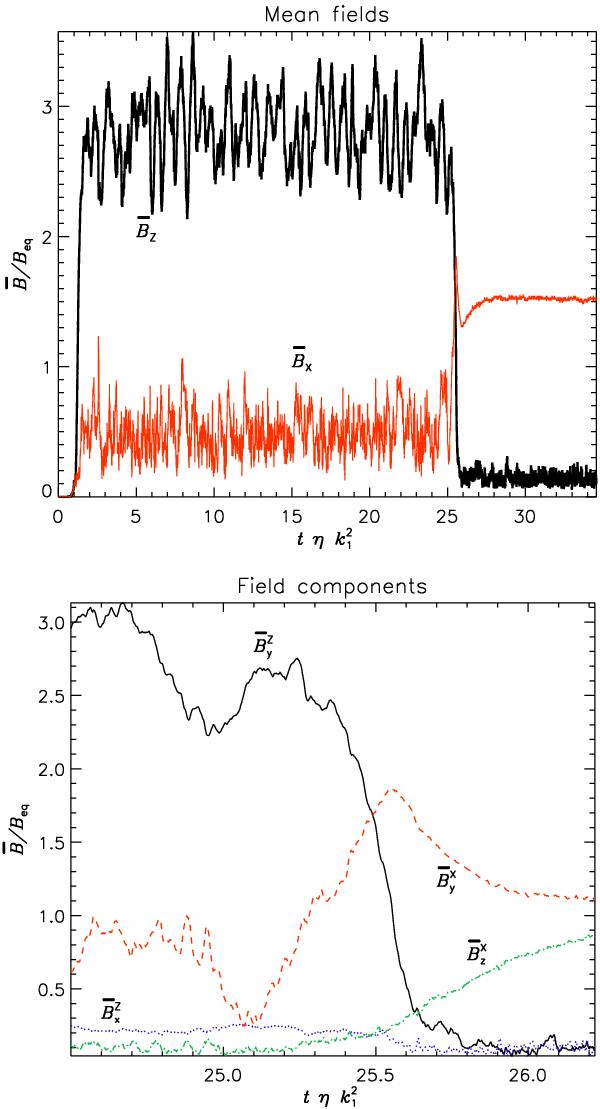
Time series of Run H. Upper panel: rms values of
 and
and
 .
Note the long time before the transition starts in comparison to Run F (see
Fig. 6) and the dramatic difference in the
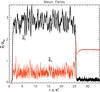
fluctuation levels before and after the transition. Lower panel:
rms values of the components. Note the strong difference between
.
Note the long time before the transition starts in comparison to Run F (see
Fig. 6) and the dramatic difference in the
fluctuation levels before and after the transition. Lower panel:
rms values of the components. Note the strong difference between
 and
and  ,
expected for an α2Ω field. More significantly, notice
that
,
expected for an α2Ω field. More significantly, notice
that  develops before
  .
.
Current usage metrics show cumulative count of Article Views (full-text article views including HTML views, PDF and ePub downloads, according to the available data) and Abstracts Views on Vision4Press platform.
Data correspond to usage on the plateform after 2015. The current usage metrics is available 48-96 hours after online publication and is updated daily on week days.
Initial download of the metrics may take a while.