Fig. 5
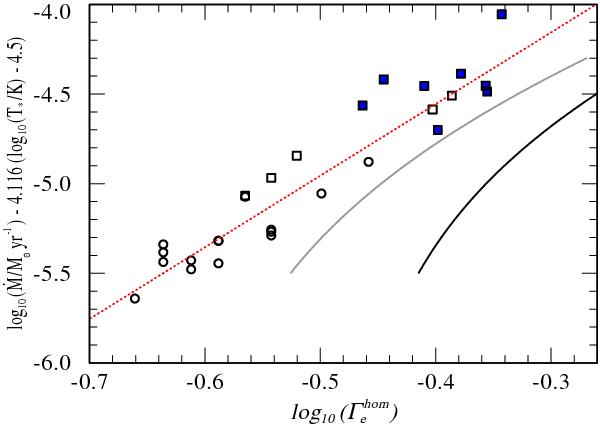
Fitted mass-loss relation for the complete Arches sample, under the assumption of chemical homogeneity (Eq. (15), red dotted line). Symbols are the same as in Fig. 3. The observed mass-loss rates are scaled to a temperature of log (T ⋆ /K) = 4.5, based on the temperature dependence in Eq. (15), with Ṁ ∝ T-4.116. For comparison, we plot the relation by Gräfener & Hamann (2008) for the same temperature, log (L) = 6.3, XH = 0.7, and Z = Z⊙ (black solid), as well as Z = Z⊙ (grey solid).
Current usage metrics show cumulative count of Article Views (full-text article views including HTML views, PDF and ePub downloads, according to the available data) and Abstracts Views on Vision4Press platform.
Data correspond to usage on the plateform after 2015. The current usage metrics is available 48-96 hours after online publication and is updated daily on week days.
Initial download of the metrics may take a while.