Fig. 9
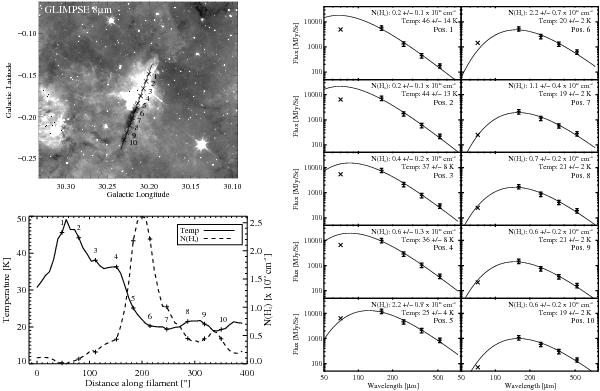
Top left: GLIMPSE 8 μm image in our ℓ = 30° test region. Right: modified blackbody fits to the points marked on the filament in the top left panel. Since the 70 μm point is not included in these fits (see Sect. 3.2) it is plotted as an X while the other points are shown with their 20% calibration error bars. The errors quoted in temperature and column density are the formal fit errors. As discussed in Sect. 4.1, these are not necessarily representative of the true errors. Bottom left: the temperature and column densities derived along the filament, with 10 points marked. Note the inverse relation between temperature and column density in this example, especially from points 8 to 10.
Current usage metrics show cumulative count of Article Views (full-text article views including HTML views, PDF and ePub downloads, according to the available data) and Abstracts Views on Vision4Press platform.
Data correspond to usage on the plateform after 2015. The current usage metrics is available 48-96 hours after online publication and is updated daily on week days.
Initial download of the metrics may take a while.