Fig. 6
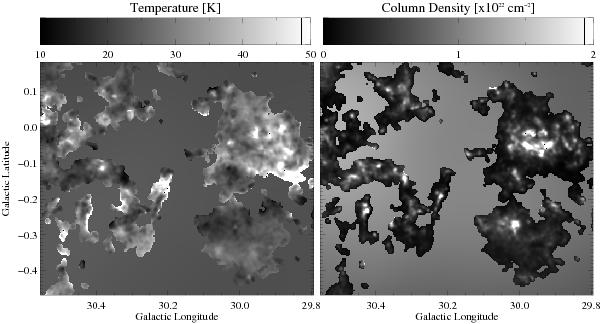
Temperature (left) and Column Density (right) maps in the ℓ = 30° field test region. In these maps, the background cirrus emission temperature and column densities are plotted outside of the source masks, while the background-subtracted temperature and column densities are plotted inside the source masks. These maps are at 25′′ resolution and assume β = 1.75 inside the source masks.
Current usage metrics show cumulative count of Article Views (full-text article views including HTML views, PDF and ePub downloads, according to the available data) and Abstracts Views on Vision4Press platform.
Data correspond to usage on the plateform after 2015. The current usage metrics is available 48-96 hours after online publication and is updated daily on week days.
Initial download of the metrics may take a while.