Fig. 4
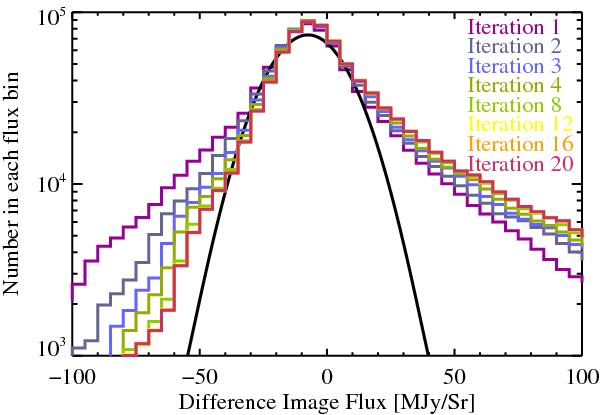
The flux distribution in the difference images (original 500 μm image – convolved cirrus image, e.g. Fig. 2 panel f)) for 8 iterations from 1 to 20 in the ℓ = 30° field. In each iteration, the negative flux distribution was mirrored about 0 and a Gaussian was fit to the distribution to determine the characteristic fluctuations so that a source identification cutoff (of 4.25σ) could be applied. Plotted here are the full distributions, not the mirrored distributions used to fit the Gaussian. As we iterate, points in the negative end are transferred to the positive end of the distribution as flux is restored in the negative bowls around bright sources. The Gaussian fit to the distribution for the final iteration (16) is shown as the black curve.
Current usage metrics show cumulative count of Article Views (full-text article views including HTML views, PDF and ePub downloads, according to the available data) and Abstracts Views on Vision4Press platform.
Data correspond to usage on the plateform after 2015. The current usage metrics is available 48-96 hours after online publication and is updated daily on week days.
Initial download of the metrics may take a while.