Fig. 2
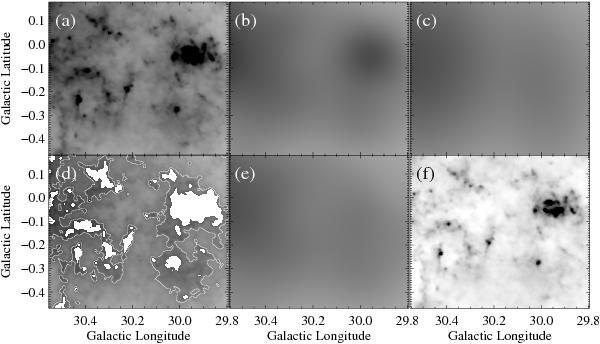
A depiction of the cirrus subtraction method for the first iteration. Panel a) is the original SPIRE 500 μm image (all images on the same linear reverse grayscale, from −10 to 900 MJy/sr). Panel b) is the smoothed SPIRE 500 μm image that is used to fit the Gaussian shown in panel c). Panel c) is then subtracted from panel a) to produce a contrast image. A 4.25σ cutoff is then applied to the contrast image to produce the source masks shown in panel d). Panel d) is the original SPIRE 500 μm image with the sources masked out in white. This is the first iteration source masks; the final source boundaries are shown as white contours. Panel d) is then convolved with a Gaussian with the masks treated as missing data to produce panel e). Panel e) is considered the cirrus image for the next iteration. In the next iteration, a Gaussian will be fit to the cirrus image e), as a function of latitude at each longitude, and steps b)–e) will repeat. Panel f) is the difference image (original SPIRE 500 μm image a) – convolved cirrus image e)) that will eventually be used for greybody fitting in the final iteration.
Current usage metrics show cumulative count of Article Views (full-text article views including HTML views, PDF and ePub downloads, according to the available data) and Abstracts Views on Vision4Press platform.
Data correspond to usage on the plateform after 2015. The current usage metrics is available 48-96 hours after online publication and is updated daily on week days.
Initial download of the metrics may take a while.