Fig. 14
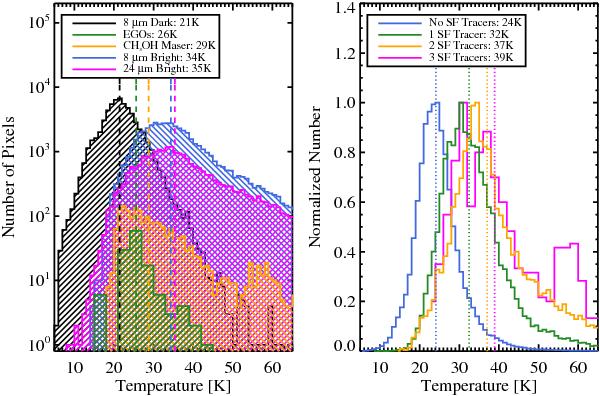
A comparison of star formation tracers in the ℓ = 30° field. The identification of these tracers is discussed in Sect. 3.3. Left: Log histogram of the temperature distributions for all source pixels identified as mIRd (8 μm dark, black), associated with EGOs (green) or a CH3OH maser (orange), mIRb (8 μm bright, blue), or 24 μm bright (magenta). The median temperature is reported in the legend and with the dashed vertical line for each tracer. If one assumes that a source will monotonically increase in temperature with time, this diagram gives a possible indication of the observed evolution of sources in this field. Right: a normalized temperature histogram for all pixels in the ℓ = 30° source masks containing 0 (blue), 1 (green), 2 (orange), and 3 (magenta) of the star formation tracers shown in the left panel. The pixels containing 4 star formation tracers are rare, follow the distribution of the EGOs, and have low number statistics and therefore are not plotted. The median temperature is again reported in the legend and with dotted vertical lines. This plot shows that warmer pixels are associated with more star formation tracers.
Current usage metrics show cumulative count of Article Views (full-text article views including HTML views, PDF and ePub downloads, according to the available data) and Abstracts Views on Vision4Press platform.
Data correspond to usage on the plateform after 2015. The current usage metrics is available 48-96 hours after online publication and is updated daily on week days.
Initial download of the metrics may take a while.