Fig. 12
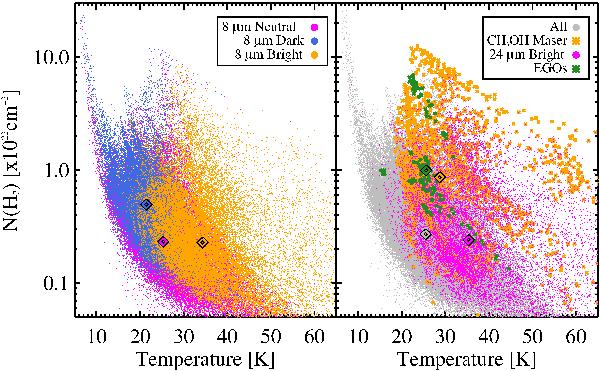
Left: a column density versus temperature plot comparing mIRn (8 μm neutral, magenta), mIRd (8 μm dark, blue), and mIRb (8 μm bright, orange) pixels within the ℓ = 30° source masks, with the median of each value plotted as a diamond on top. The mIRd points occupy the coldest, highest column density portion of the plot, while the mIRb points occupy a range of column densities and warmer temperatures. The mIRn points at the extreme left of the plot are due to the imperfect definition of the 8 μm masks. Right: a similar plot as the left, but with all points (gray), points associated with a CH3OH maser (orange) or EGO (green), and 24 μm bright points (magenta). We note that EGOs occupy a mid-range temperature and the highest column density portion of this plot, while the CH3OH maser points occupy a wide mid-range of temperatures and a high range of column densities. The 24 μm points are associated with higher temperature points and relatively low column density.
Current usage metrics show cumulative count of Article Views (full-text article views including HTML views, PDF and ePub downloads, according to the available data) and Abstracts Views on Vision4Press platform.
Data correspond to usage on the plateform after 2015. The current usage metrics is available 48-96 hours after online publication and is updated daily on week days.
Initial download of the metrics may take a while.