Fig. 9
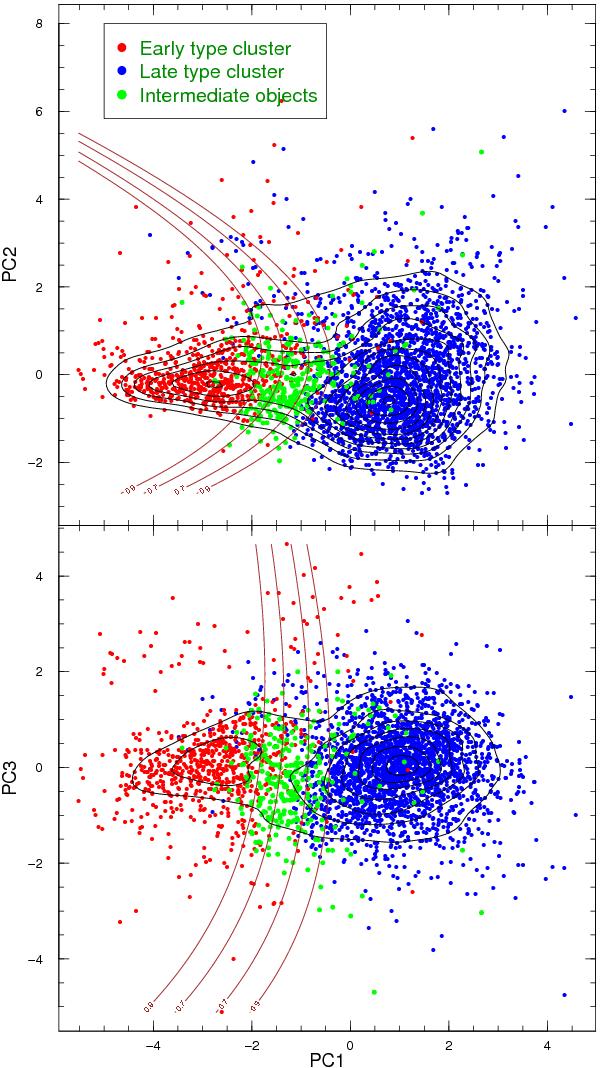
Cluster analysis results for low redshift galaxies. Superimposed to the points, as in Fig. 5, are the isodenses of the points calculated via kernel smoothing in PC1-PC2 and PC1-PC3 planes. The curved lines represent the projected isoprobability curves. Clusters and green valley objects appear more scattered across the planes because of effects of projection from the four-dimensional PCA to the two dimensions of the plot.
Current usage metrics show cumulative count of Article Views (full-text article views including HTML views, PDF and ePub downloads, according to the available data) and Abstracts Views on Vision4Press platform.
Data correspond to usage on the plateform after 2015. The current usage metrics is available 48-96 hours after online publication and is updated daily on week days.
Initial download of the metrics may take a while.