Free Access
Fig. 6
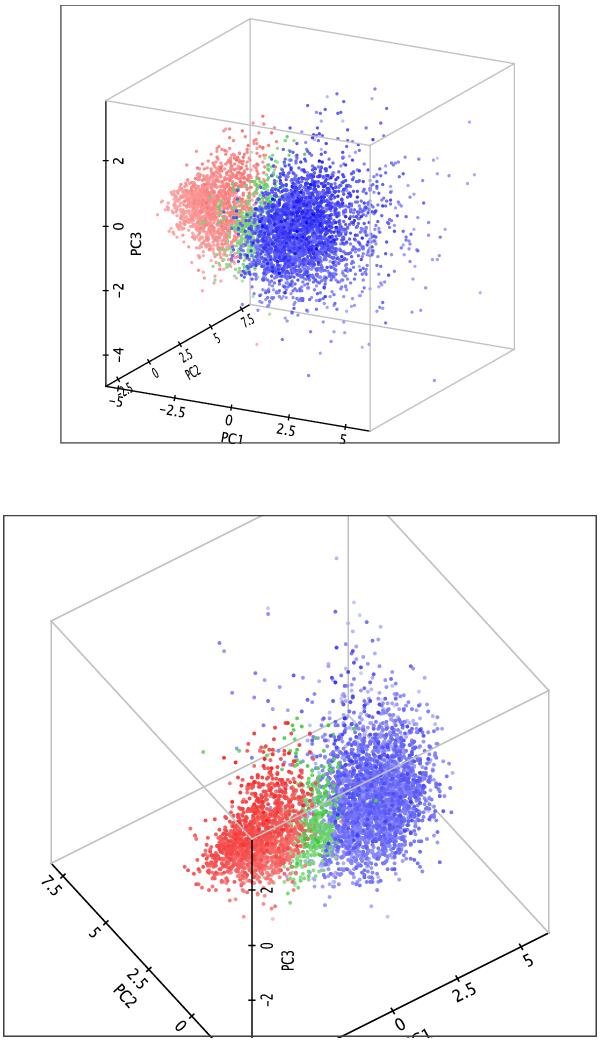
Two different three-dimensional visualizations of the PC space. The colours represent the clusters as defined by the UFP cluster analysis in Fig. 5. Different intensities of the colours represent the distance of the point from the vantage point, trying to give the idea of the depth of the points distribution.
This figure is made of several images, please see below:
Current usage metrics show cumulative count of Article Views (full-text article views including HTML views, PDF and ePub downloads, according to the available data) and Abstracts Views on Vision4Press platform.
Data correspond to usage on the plateform after 2015. The current usage metrics is available 48-96 hours after online publication and is updated daily on week days.
Initial download of the metrics may take a while.