Fig. 5
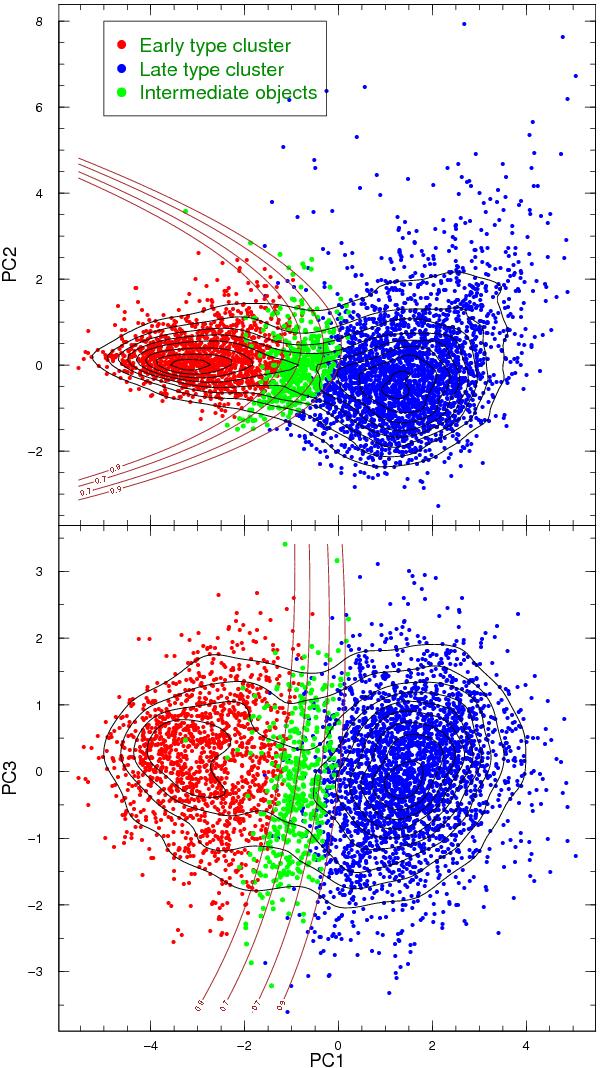
Result of the unsupervised fuzzy partition (UFP) clustering algorithm applied to the PCA-reduced whole sample: the upper panel represents the PC1-PC2 plane, while the lower panel represents the PC1-PC3 plane. In red are early type galaxies, in blue late type galaxies, in green our intermediate objects. Brown lines are the interceptions on both planes of the 70% and 90% isoprobability surfaces. Black lines are the isodensity curves of the points in the planes, computed via Gaussian kernel smoothing.
Current usage metrics show cumulative count of Article Views (full-text article views including HTML views, PDF and ePub downloads, according to the available data) and Abstracts Views on Vision4Press platform.
Data correspond to usage on the plateform after 2015. The current usage metrics is available 48-96 hours after online publication and is updated daily on week days.
Initial download of the metrics may take a while.