Fig. 2
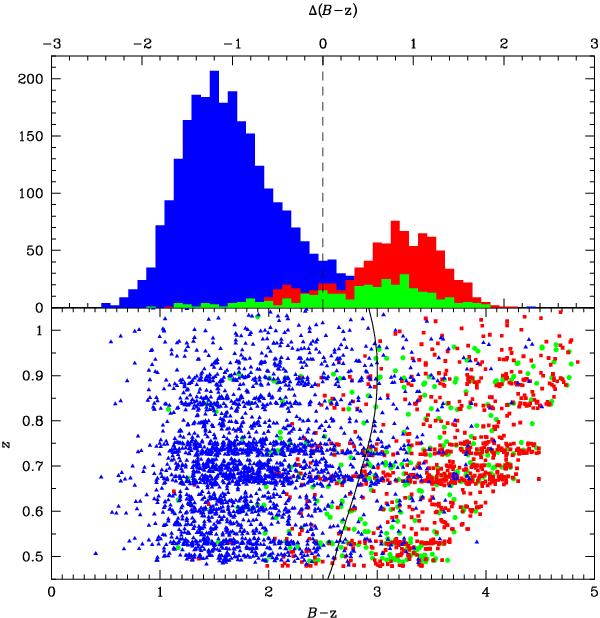
Photometric classification of the 10k zCOSMOS-bright high quality sample. In the lower panel colour B − z versus redshift z is shown: blue triangles are star-forming, red squares are quiescent, green dots are red emitting galaxies. Solid line represents the evolutionary B − z track of a template Sab galaxy from Coleman et al. (1980) (Sawicki et al. 1997). In the upper panel the distributions of Δ(B − z), as defined in Eq. (3), for star-forming galaxies (blue histogram), quiescent galaxies (red histogram) and red emitting galaxies (green histogram) are plotted. The dashed line represents Δ(B − z) of the Sab galaxy evolutionary track used as separator.
Current usage metrics show cumulative count of Article Views (full-text article views including HTML views, PDF and ePub downloads, according to the available data) and Abstracts Views on Vision4Press platform.
Data correspond to usage on the plateform after 2015. The current usage metrics is available 48-96 hours after online publication and is updated daily on week days.
Initial download of the metrics may take a while.