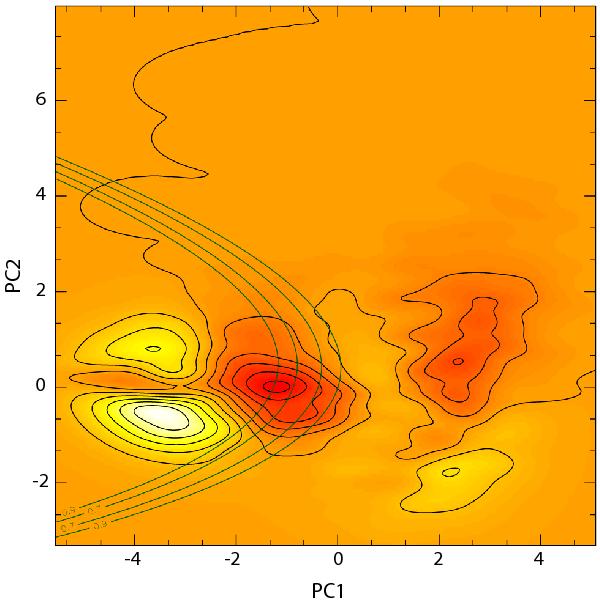
Fig. 14

Bidimensional density map representing residuals from the subtraction of the three-dimensional Gaussian model in Fig. 13a from the actual data density in Fig. 13b. Left side negative (light) cores and right side positive (dark) cores are due to the asymmetries in actual data densities that the model was not able to replicate. The dark core near the center of the image is due to the excess of galaxies in the saddle with respect to the Gaussian model. PCA+UFP isoprobability curves, taken from Fig. 3 are also shown.
Current usage metrics show cumulative count of Article Views (full-text article views including HTML views, PDF and ePub downloads, according to the available data) and Abstracts Views on Vision4Press platform.
Data correspond to usage on the plateform after 2015. The current usage metrics is available 48-96 hours after online publication and is updated daily on week days.
Initial download of the metrics may take a while.


