Fig. 11
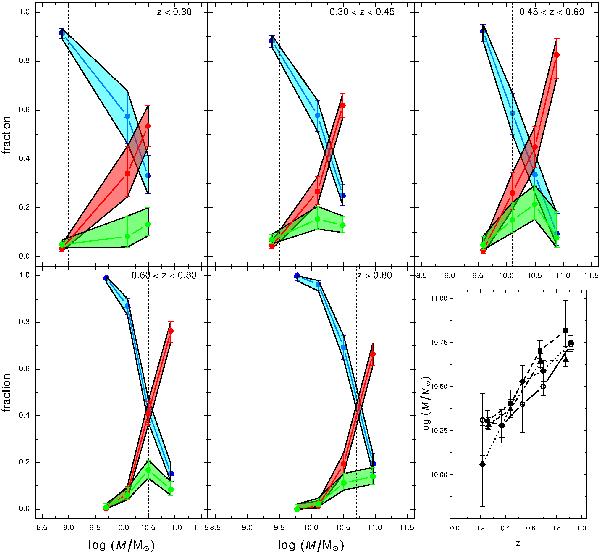
Evolution with redshift of the fractions of different galaxy populations in mass. Each panel shows the fraction of galaxies in each mass bin that belong to each PCA+UFP cluster (in cyan are late-type galaxies, in red the early-type ones, in green the green valley ones), in a specific redshift bin. Errors are 95% confidence intervals for multinomial populations (Miller 1966). Vertical dotted lines represent the 90% mass completeness in each redshift bin. The last panel represents the evolution in z of the transition mass (Mcross), defined as the point where red line and cyan line meet (open circles and solid line). Errors associated are given by the width of the region where the two strips meet. Dashed and dot-dashed lines represent the transition masses as calculated in Pozzetti et al. (2010), respectively using Marseille morphologies and SED colours photometric classifications. The dotted line represents the transition masses as calculated using Balogh et al. (2004) definition of green valley applied to our combined sample (see Sect. 5.2).
Current usage metrics show cumulative count of Article Views (full-text article views including HTML views, PDF and ePub downloads, according to the available data) and Abstracts Views on Vision4Press platform.
Data correspond to usage on the plateform after 2015. The current usage metrics is available 48-96 hours after online publication and is updated daily on week days.
Initial download of the metrics may take a while.