Fig. 10
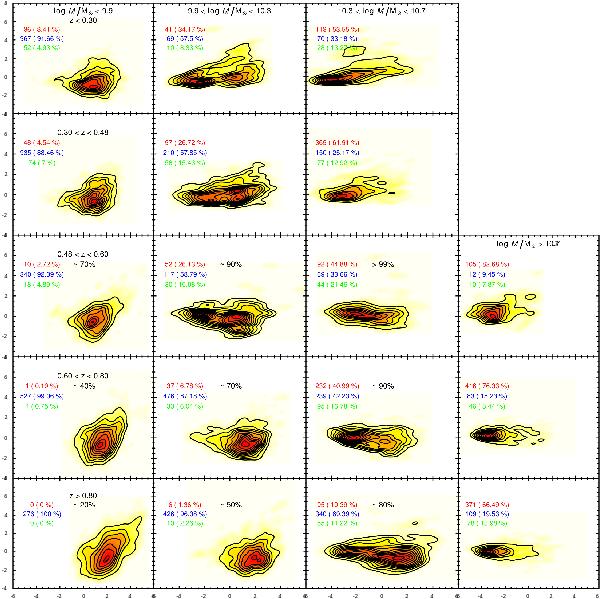
PC1-PC2 diagrams for low redshift (upper two rows) and high redshift (lower three rows) samples, kernel smoothed with the usual technique. Columns represent bins of mass (growing from left to right, as specified inside first row boxes), while rows represent bins of redshift (growing from top to bottom, as specified in first column boxes). In each panel are also shown the absolute numbers and fractions of galaxies in each cluster (early-type, late-type and green valley), in red, blue and green respectively. In some of the high redshift panels are shown the mass completenesses (as computed by Pozzetti et al. 2010); where there are no percentages the sample has to be intended as mass-complete.
Current usage metrics show cumulative count of Article Views (full-text article views including HTML views, PDF and ePub downloads, according to the available data) and Abstracts Views on Vision4Press platform.
Data correspond to usage on the plateform after 2015. The current usage metrics is available 48-96 hours after online publication and is updated daily on week days.
Initial download of the metrics may take a while.