Fig. 6
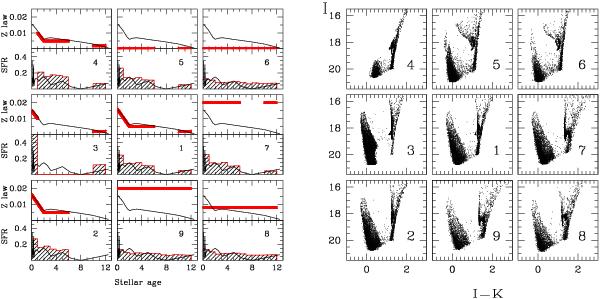
Left panel: a series of synthetic SFH and metallicity functions are shown. The thin (black) lines are always the SFH and metallicity function of a field of the LMC bar, as derived from Holtzman et al. (1999). The thick (red) lines and the histograms show the values used to simulate the synthetic populations in order to find the best model that matches our observations. Right panel: synthetic I, I − Ks CMDs for different SFHs and metallicity functions, given in left panels. The number of the model is specified in each single panel as it is referred to in the text and in Tables 3 and 4.
Current usage metrics show cumulative count of Article Views (full-text article views including HTML views, PDF and ePub downloads, according to the available data) and Abstracts Views on Vision4Press platform.
Data correspond to usage on the plateform after 2015. The current usage metrics is available 48-96 hours after online publication and is updated daily on week days.
Initial download of the metrics may take a while.