Fig. 7
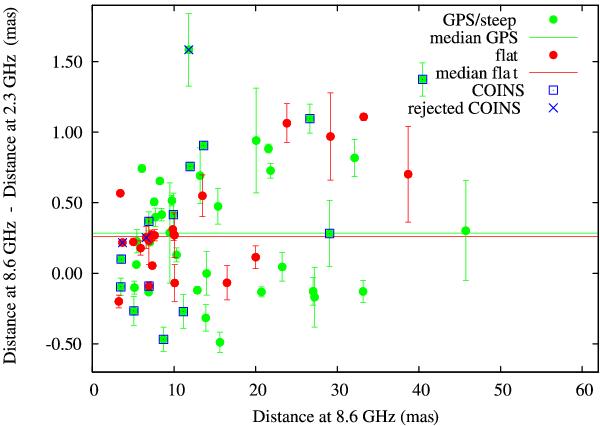
Difference in distances between two dominant source components measured in the S and X bands as a function of distance measured in the X band. Green points represent GPS and steep spectrum sources, red points represent flat spectrum sources. Objects included in the COINS sample are marked with blue squares, while objects rejected from the COINS sample as probable core-jet sources are marked with blue crosses. The green line denotes the median distance difference for GPS/steep spectrum sources, the red line marks the same for flat spectrum sources.
Current usage metrics show cumulative count of Article Views (full-text article views including HTML views, PDF and ePub downloads, according to the available data) and Abstracts Views on Vision4Press platform.
Data correspond to usage on the plateform after 2015. The current usage metrics is available 48-96 hours after online publication and is updated daily on week days.
Initial download of the metrics may take a while.