Fig. 15
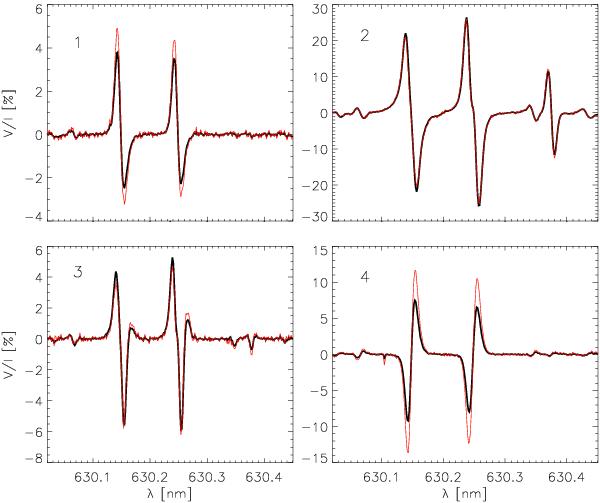
Stokes V spectra from the sunspot observation. Red: deconvolved spectra. Black: original spectra. The numbers in the upper left of each panel refer to the labels in Fig. 13 that indicate the locations of the spectra in the 2D maps of the sunspot observation.
Current usage metrics show cumulative count of Article Views (full-text article views including HTML views, PDF and ePub downloads, according to the available data) and Abstracts Views on Vision4Press platform.
Data correspond to usage on the plateform after 2015. The current usage metrics is available 48-96 hours after online publication and is updated daily on week days.
Initial download of the metrics may take a while.